
The difference-in-difference (DID) design is probably the most frequently used design of natural experiments. The DID design aims to estimate an average treatment effect by comparing the pre-treatment to post-treatment changes in an outcome variable (e.g., job satisfaction, job performance) between a treatment group (i.e., individuals, groups or organizations that received a treatment) and a control group (i.e., individuals, groups or organizations that did not receive a treatment). The “simplest” form of the DID design is the two groups in two periods design (Wing et al. 2018). For instance, company A may would like to know whether more delicious food in the company’s cafeteria is related to higher job satisfaction. To test the relationship, the company first collects data on employee job satisfaction at time t-0. Then, the company hires a renowed cook for its cafeteria in factory A (treatment group) but makes no changes in the cafeteria in factory B (control group). At time t-1, the company again collects data on employee job satisfaction. The results of the survey are as follows:
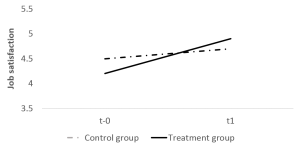
Factory A: Job satisfaction in t-0 = 4.2; job satisfaction in t-1 = 4.9
Factory B: Job satisfaction in t-0 = 4.5; job satisfaction in t-1 = 4.7
The figure below visualizes the changes in job satisfaction from t-0 to t-1 for both groups.
To calculate the average effect of the treatment (more delicious food) on the outcome (job satisfaction), we can use the rather simple formula:
Average treatment effect (ATE) = (yt-1,T – yt-0, T) – (yt-1, C – yt-0, C)
where yt-1, T is the average job satisfaction of the treatment group in t-1 (4.9), yt-o, T is the average job satisfaction of the treatment group in t-0 (4.2), yt-1, C is the average job satisfaction of the control group in t-1 (4.7), and yt-0, C is the average job satisfaction of the control group in t-0 (4.5). Therefore, the ATE is (4.9-4.2) – (4.7-4.5) = 0.5, which indicates that more delicious food at the company’s cafeteria leads to an on average 0.5 points higher job satisfaction.